Python | MATLAB
Data Mining | Predictive Analytics | Unsupervised Learning | CI/CD
Video & Image Processing | 2D & 3D Object Detection | Segmentation
Insight Generation | Google Looker Studio | Tableau | Microsoft Power BI
Sentiment Analysis | OpenAI APIs | ChatGPT Models
Amazon Web Services
Pahwa, R. S., Chang, R., Jie, W., Satini, S., Viswanathan, C., Yiming, D., Jain, V., Pang, C. T., & Wah, W. K. (1970, January 1). A survey on object detection performance with different data distributions. https://link.springer.com/chapter/10.1007/978-3-030-90525-5_48"
Chang, R., Pahwa, R. S., Wang, J., Chen, L.,Satini, S.,Wan, K. W., & Hsu, D. (2022, April 7). Creating semi-supervised learning-based Adaptable Object Detection Models for Autonomous Service Robot. SSRN. https://papers.ssrn.com/sol3/papers.cfm?abstract_id=4075994
Github Link: https://github.com/sankeerthana14/MDP---Robot-Vision.git
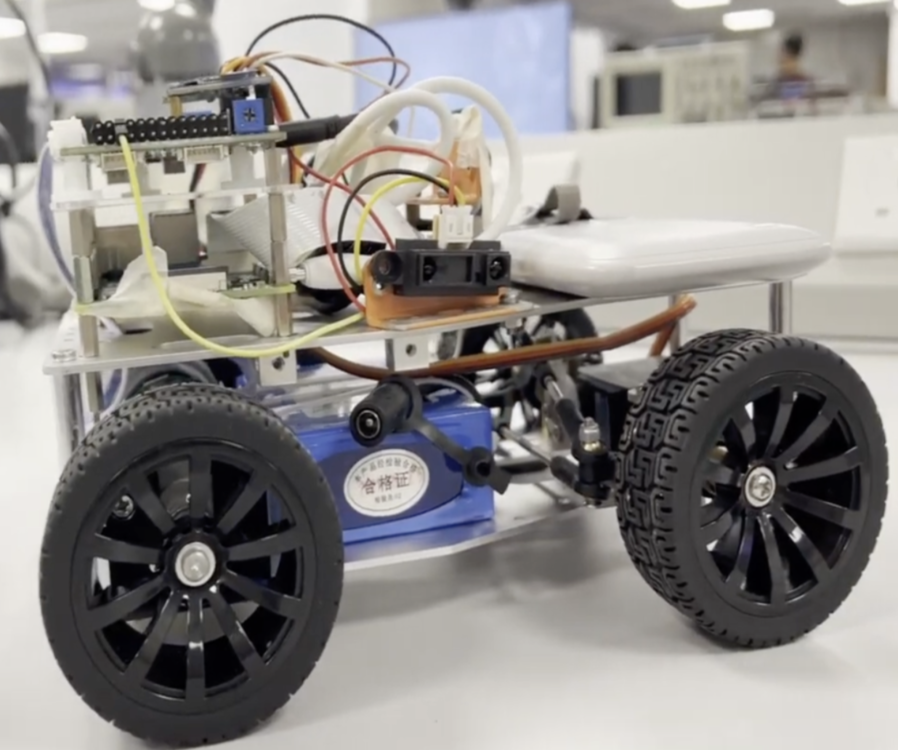
This project was a part of the Multi-disciplinary Project module at NTU, where we had to build a robot that would be able to navigate its way through an obstacle course while correctly identifying the letters pasted on the obstacles in the shortest amount of time. I was responsible for the Vision of the Robot.
This was essentially an end-to-end project spanning from Data Collection to Deployment.
Data Collection included collecting the images of the target objects from different angles and distances to account for variety in the dataset. As a part of the Data Processing, this included, removing all the blurry images and labelling the images using LabelImg and applying data augmentations such as Resizing to account for the different size of the object as well as to balance the classes with lesser number of images. To effectively train the model, I split the dataset into Training - Validation - Test Split and trained the YOLOv5 on the Training set. After which, hyperparameter tuning was done by trying different sets of hyperparameters. The best performing set of hyperparameters was then evaluated on the Test Set. The final model was then deployed into the Raspberry Pi.
Github Link: https://github.com/sankeerthana14/fyp-pedestrian-detection.git
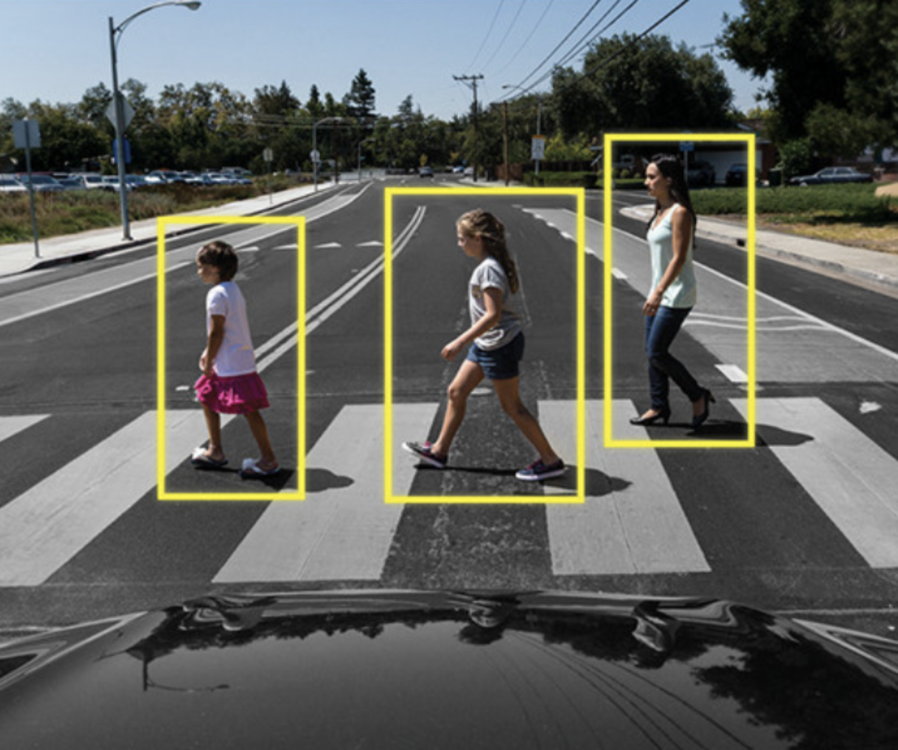
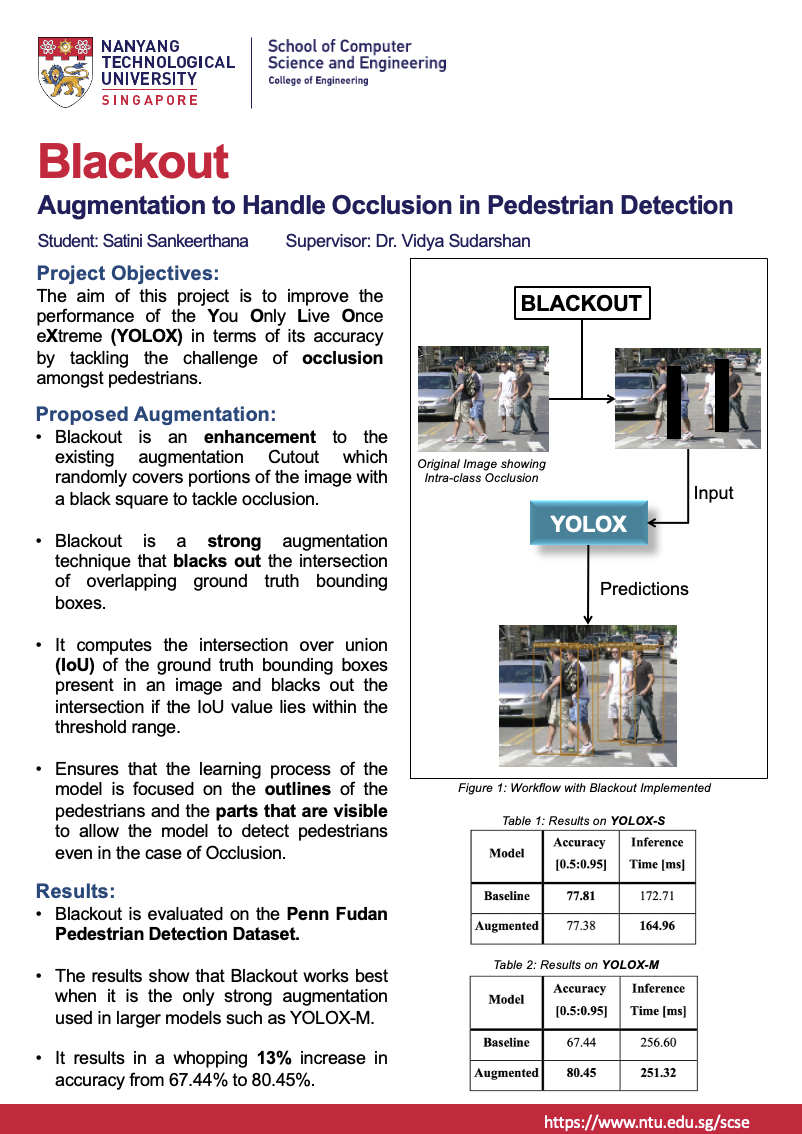
This project was my Final Year Project (FYP) where I got the chance to design and execute a research project from scratch. The scope was Pedestrian Detection and the deliverables of this project are a Research Report and a Research Poster published in NTU's collections.
After conducting a comprehensive Literature Review where I critically analysed the current state-of-the computer vision models as well as approaches that were being implemented in the field of Pedestrian Detection so far, Pedestrian Occlusion specifically intra-class pedestrian occlusion was a pressing problem.
In order to mitigate the effects of Intra-class Pedestrian Occlusion, I came up with a novel modification to an existing augmentation technique - 'Cutout'. Cutout applies black square patches on the image to mimic an occlusion This allows the model to learn how to handle occluded cases in real-life scenarios. However, this doesn't mitigate the effects of Intra-class Occlusion.
Hence, I modified the augmentation to overlay black square patches using an IoU threshold strategy such that the model learns to focus on the non-occluded part of the pedestrian to effectively mitigate the effects of Intra-class Occlusion.
With this new augmentation, there was a whopping 13% increase in detection accuracy of the YOLOX model that was trained on the Penn-Fudan Pedestrian Detection Dataset.
Research Poster detailing the key points.
Github Link: https://github.com/sankeerthana14/EmoRecTFR.git
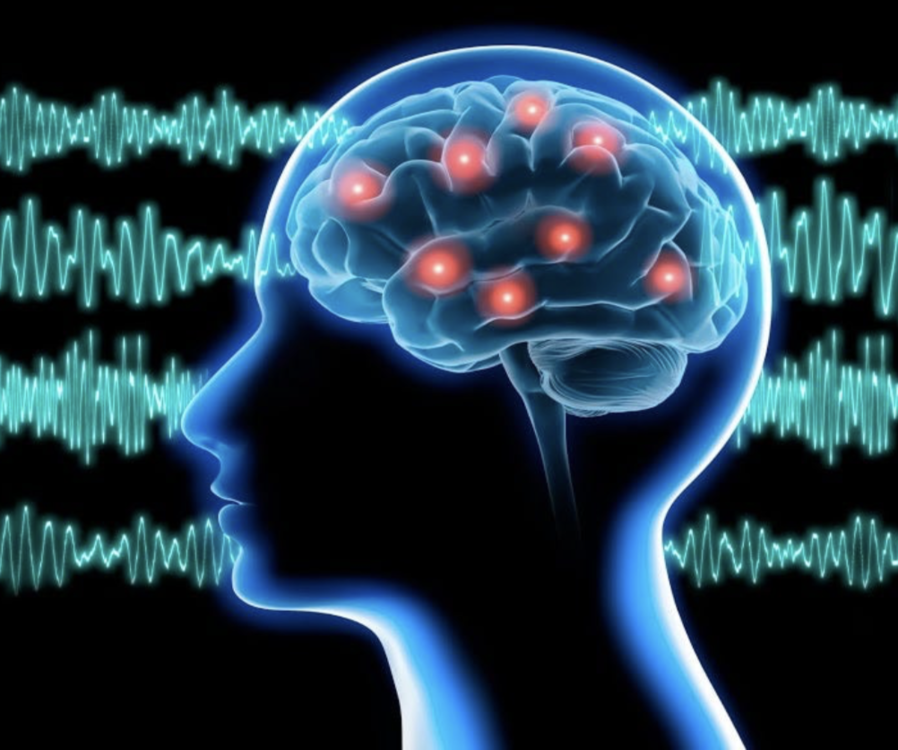
This project was done as a part of NTU's Undergraduate Research Experience on Campus (URECA) Programme. This Programme was for open for selected students to pursue research at an undergraduate level.
The Problem to solve was to create a Deep Learning Model that would recognise Emotions from EEG Signals. The model chosen was ResNet50 and the raw EEG Signals were processed. The processing steps included signal processing steps such as filtering and normalization. Synchrosqueeze Transform was applied to the EEG Signals and images of the transformed EEG frequency graphs were collated and arranged into a dataset.
The ResNet50 model was then trained on this dataset, and hyperparameter tuning was done to find the best results. Please feel free to take a look at the codes via the Github Link above.
Github Link: https://github.com/sankeerthana14/IR-Sentiment-Analysis.git
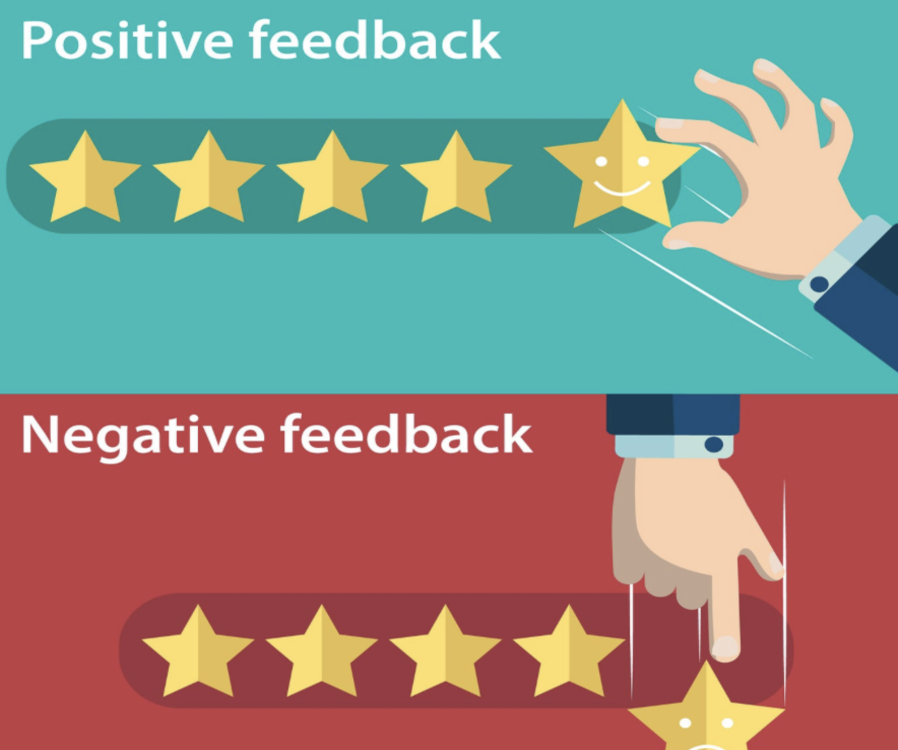
In this Project, given crawled dataset compiled from web scraping of e-commerce websites. I explored various tools/packages to generate labels such as 'Flair', 'Spacy' and 'Vader' and compared their performance and accuracy of the generated labels.
After necessary data processing steps including Tokenization and SMOTE to tackle the problem of imbalanced classes in the dataset, I created a Simple RNN architecture and a CNN architecture from scratch to classify the reviews into Positive or Negative. Hyperparameter tuning was also done to get the best results for both the models.
Example of a review detection by RNN.
"I have combination sensitive skin, even Cera Ve daily moisturizer causes irritation. This cream is the best I’ve ever felt AND reduces redness. Will definitely be restocking once my first order goes empty!"
Actual Class: Positive
RNN Detected Class: Positive
Please feel free to take a look at the codes in the Github Link above.
Github Link: https://github.com/sankeerthana14/Mask-Detection.git
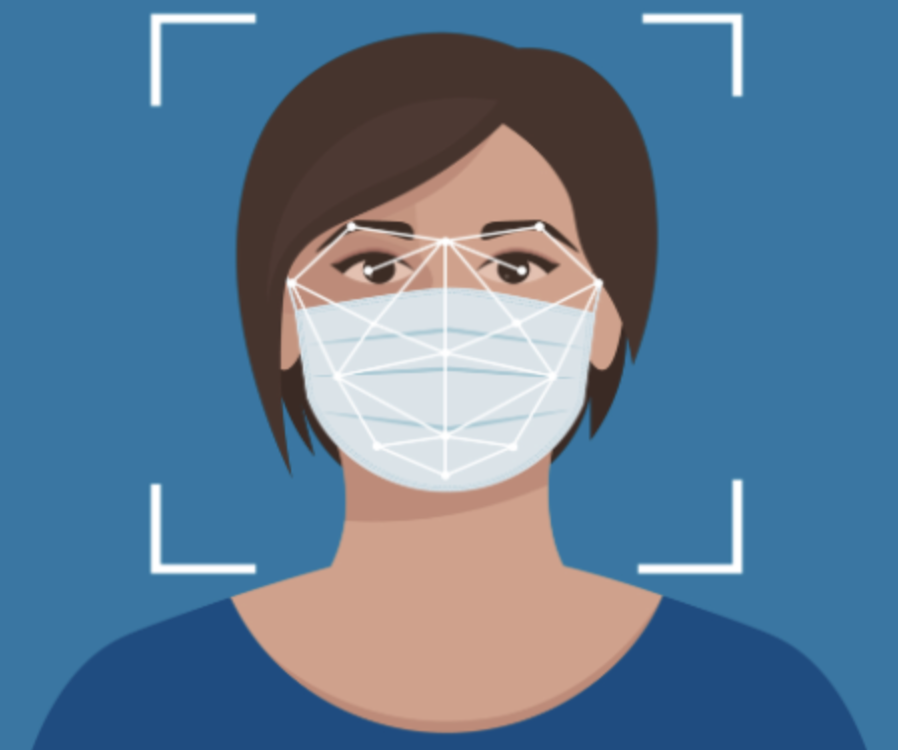
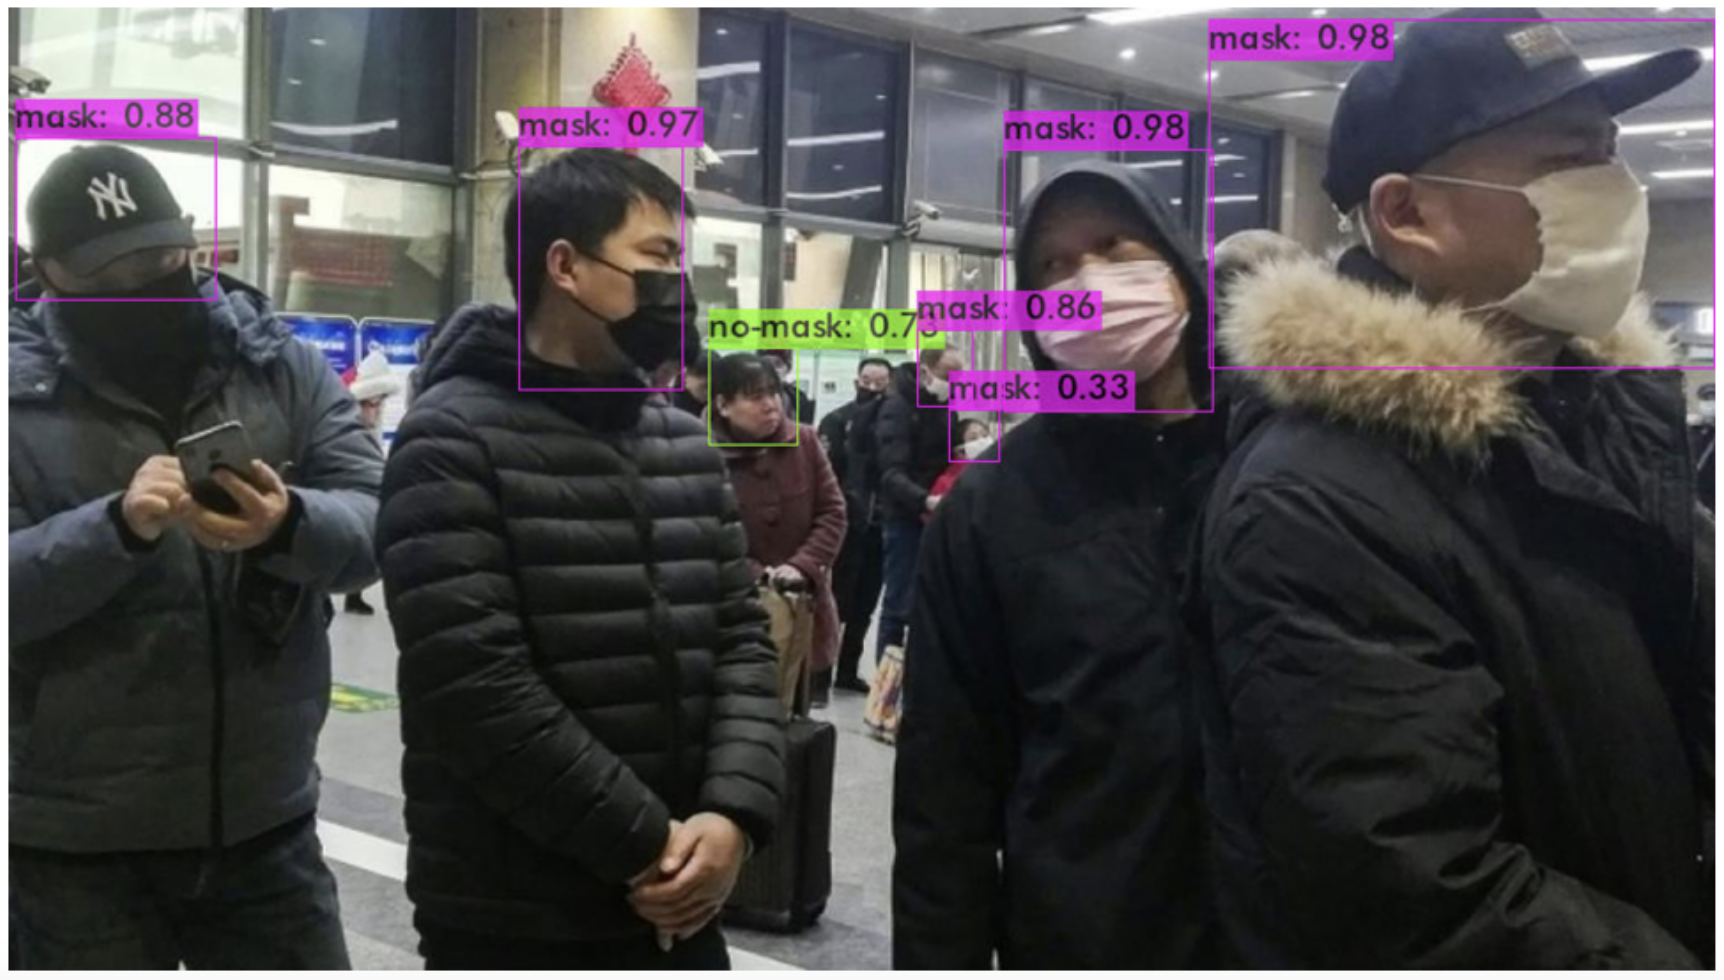
Prior to this Project, I had implemented Object Detection Models using Tensorflow and PyTorch. However, in a bid to try something new, through this personal project, I explored training and evaluating a YOLOv4 model with the DarkNet framework using Linux Commands. The YOLOv4 model was trained on the Roboflow Mask Detection dataset and evaluated on the same.
Detections made by the YOLOv4.
Please feel free to take a look at the codes in the Github Link above.
Github Link: https://github.com/sankeerthana14/recommendation-system-viz.git
This was essentially an end-to-end project spanning from Data processing to Dashboard Visualization.
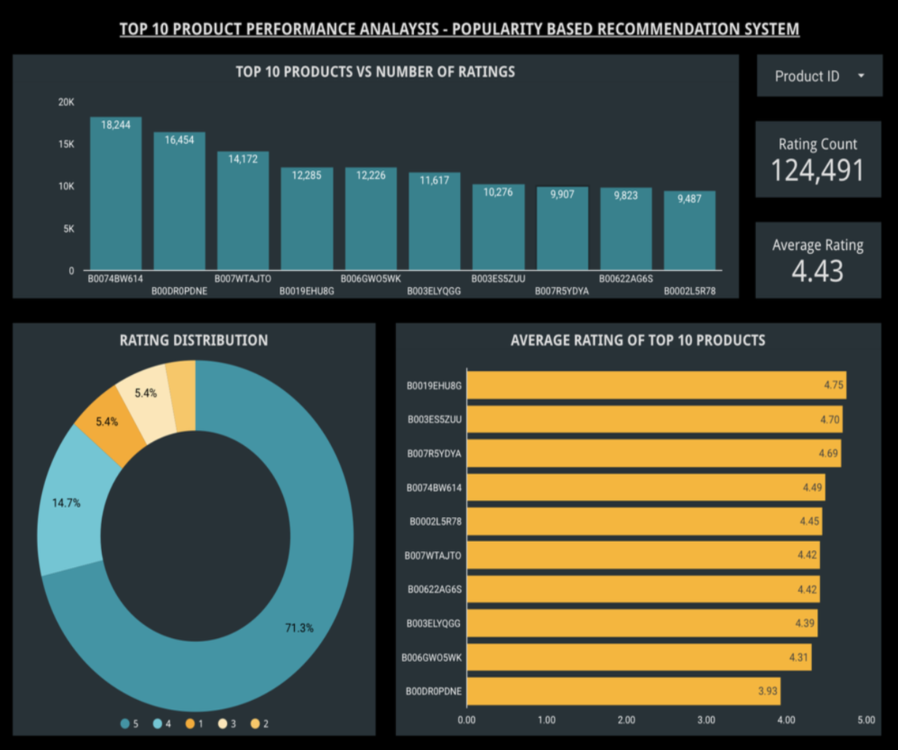
In this project, I implemented a Popularity Based Recommendation System that returns the top 10 products based on the number of reviews each product has gotten. This is a brute force approach and hence to make it more robust. I have implemented certain steps such as calculating the average rating received and factoring it in when it comes to recommending the top products.
I have then visualized the results in the form of a dashboard as dashboard allows us to extract more insights about each product, as well as all the products as a whole. The dashboard has been creted using Google Looker Studio.
Feel free to reach out to me :)